Note
Click here to download the full example code
Plot group-level ERPs across percentiles of continuous variable
# Authors: Jose C. Garcia Alanis <alanis.jcg@gmail.com>
#
# License: BSD (3-clause)

import numpy as np
import pandas as pd
import matplotlib.pyplot as plt

from mne import combine_evoked
from mne.datasets import limo
from mne.viz import plot_compare_evokeds
Here, we’ll import multiple subjects from the LIMO-dataset and explore the group-level averages (i.e., grand-averages) for percentiles of a continuous variable.
# subject ids
subjects = range(2, 19)
# create a dictionary containing participants data for easy slicing
limo_epochs = {str(subj): limo.load_data(subject=subj) for subj in subjects}

# interpolate missing channels
for subject in limo_epochs.values():
    subject.interpolate_bads(reset_bads=True)
    # only keep eeg channels
    subject.pick_types(eeg=True)
Out:
1052 matching events found
No baseline correction applied
Adding metadata with 2 columns
0 projection items activated
0 bad epochs dropped
1072 matching events found
No baseline correction applied
Adding metadata with 2 columns
0 projection items activated
0 bad epochs dropped
1050 matching events found
No baseline correction applied
Adding metadata with 2 columns
0 projection items activated
0 bad epochs dropped
1118 matching events found
No baseline correction applied
Adding metadata with 2 columns
0 projection items activated
0 bad epochs dropped
1108 matching events found
No baseline correction applied
Adding metadata with 2 columns
0 projection items activated
0 bad epochs dropped
1060 matching events found
No baseline correction applied
Adding metadata with 2 columns
0 projection items activated
0 bad epochs dropped
1030 matching events found
No baseline correction applied
Adding metadata with 2 columns
0 projection items activated
0 bad epochs dropped
1059 matching events found
No baseline correction applied
Adding metadata with 2 columns
0 projection items activated
0 bad epochs dropped
1038 matching events found
No baseline correction applied
Adding metadata with 2 columns
0 projection items activated
0 bad epochs dropped
1029 matching events found
No baseline correction applied
Adding metadata with 2 columns
0 projection items activated
0 bad epochs dropped
943 matching events found
No baseline correction applied
Adding metadata with 2 columns
0 projection items activated
0 bad epochs dropped
1108 matching events found
No baseline correction applied
Adding metadata with 2 columns
0 projection items activated
0 bad epochs dropped
998 matching events found
No baseline correction applied
Adding metadata with 2 columns
0 projection items activated
0 bad epochs dropped
1076 matching events found
No baseline correction applied
Adding metadata with 2 columns
0 projection items activated
0 bad epochs dropped
1061 matching events found
No baseline correction applied
Adding metadata with 2 columns
0 projection items activated
0 bad epochs dropped
1098 matching events found
No baseline correction applied
Adding metadata with 2 columns
0 projection items activated
0 bad epochs dropped
1103 matching events found
No baseline correction applied
Adding metadata with 2 columns
0 projection items activated
0 bad epochs dropped
Computing interpolation matrix from 117 sensor positions
Interpolating 11 sensors
Computing interpolation matrix from 121 sensor positions
Interpolating 7 sensors
Computing interpolation matrix from 119 sensor positions
Interpolating 9 sensors
Computing interpolation matrix from 122 sensor positions
Interpolating 6 sensors
Computing interpolation matrix from 118 sensor positions
Interpolating 10 sensors
Computing interpolation matrix from 117 sensor positions
Interpolating 11 sensors
Computing interpolation matrix from 117 sensor positions
Interpolating 11 sensors
Computing interpolation matrix from 121 sensor positions
Interpolating 7 sensors
Computing interpolation matrix from 116 sensor positions
Interpolating 12 sensors
/home/josealanis/Documents/github/mne-stats/examples/group_level/plot_group_analysis.py:32: RuntimeWarning: No bad channels to interpolate. Doing nothing...
  subject.interpolate_bads(reset_bads=True)
Computing interpolation matrix from 115 sensor positions
Interpolating 13 sensors
Computing interpolation matrix from 122 sensor positions
Interpolating 6 sensors
Computing interpolation matrix from 114 sensor positions
Interpolating 14 sensors
Computing interpolation matrix from 117 sensor positions
Interpolating 11 sensors
Computing interpolation matrix from 125 sensor positions
Interpolating 3 sensors
Computing interpolation matrix from 126 sensor positions
Interpolating 2 sensors
Computing interpolation matrix from 122 sensor positions
Interpolating 6 sensors
create factor for phase-variable
name = "phase-coherence"
factor = 'factor-' + name
for subject in limo_epochs.values():
    df = subject.metadata
    df[factor] = pd.cut(df[name], 11, labels=False) / 10
    # overwrite metadata
    subject.metadata = df
Out:
Replacing existing metadata with 3 columns
Replacing existing metadata with 3 columns
Replacing existing metadata with 3 columns
Replacing existing metadata with 3 columns
Replacing existing metadata with 3 columns
Replacing existing metadata with 3 columns
Replacing existing metadata with 3 columns
Replacing existing metadata with 3 columns
Replacing existing metadata with 3 columns
Replacing existing metadata with 3 columns
Replacing existing metadata with 3 columns
Replacing existing metadata with 3 columns
Replacing existing metadata with 3 columns
Replacing existing metadata with 3 columns
Replacing existing metadata with 3 columns
Replacing existing metadata with 3 columns
Replacing existing metadata with 3 columns
compute grand averages for phase-coherence factor
# get levels of phase_coherence factor
pc_factor = limo_epochs[str(subjects[0])].metadata[factor]
# create dict of colors for plot
colors = {str(val): val for val in sorted(pc_factor.unique())}
# evoked responses per subject
evokeds = list()
for subject in limo_epochs.values():
subject_evo = {str(val): subject[subject.metadata[factor] == val].average()
for val in colors.values()}
evokeds.append(subject_evo)
# evoked responses per level of phase-coherence
factor_evokeds = list()
for val in colors:
factor_evo = {val: [evokeds[ind][val] for ind in range(len(evokeds))]}
factor_evokeds.append(factor_evo)
# average phase-coherence betas
weights = np.repeat(1 / len(subjects), len(subjects))
grand_averages = {val: combine_evoked(factor_evokeds[i][val], weights=weights)
for i, val in enumerate(colors)}
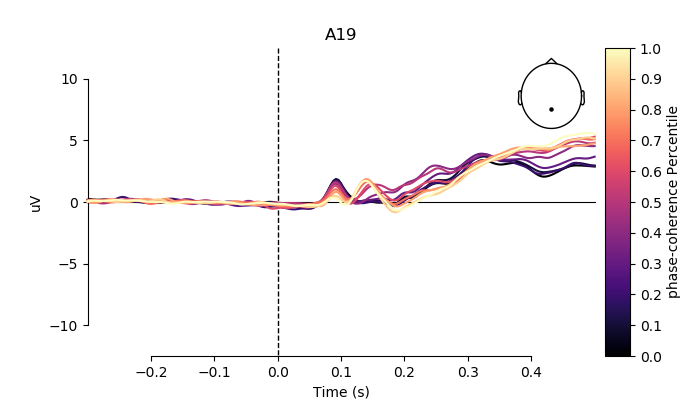
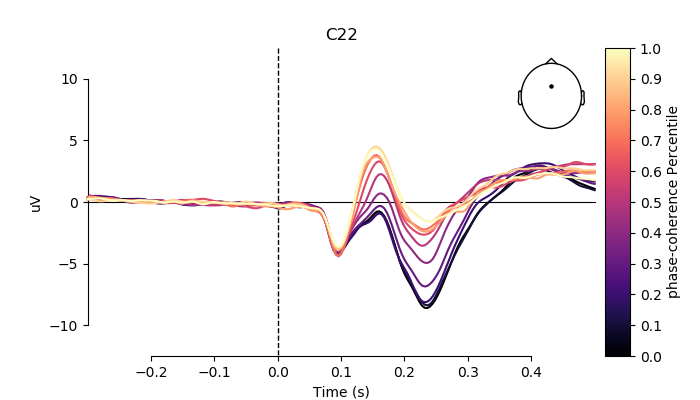
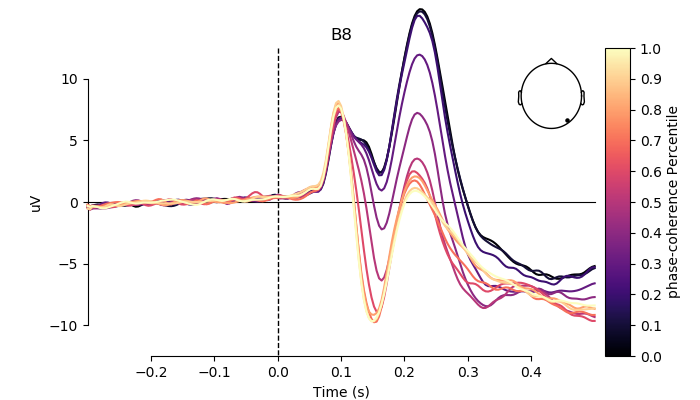
# pick channel to plot
electrodes = ['A19', 'C22', 'B8']
# create figs
for electrode in electrodes:
fig, ax = plt.subplots(figsize=(7, 4))
plot_compare_evokeds(grand_averages,
axes=ax,
ylim=dict(eeg=[-12.5, 12.5]),
colors=colors,
split_legend=True,
picks=electrode,
cmap=(name + " Percentile", "magma"))
plt.show()
Out:
/home/josealanis/anaconda3/lib/python3.7/site-packages/matplotlib/figure.py:445: UserWarning: Matplotlib is currently using agg, which is a non-GUI backend, so cannot show the figure.
  % get_backend())
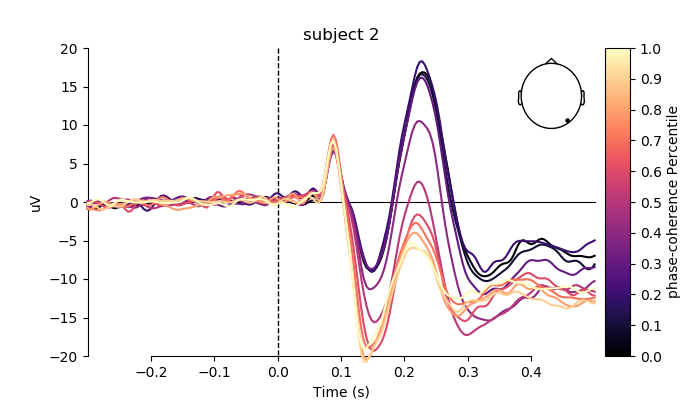
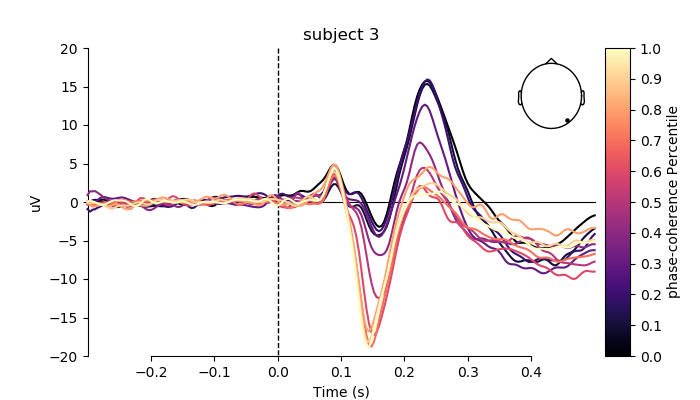
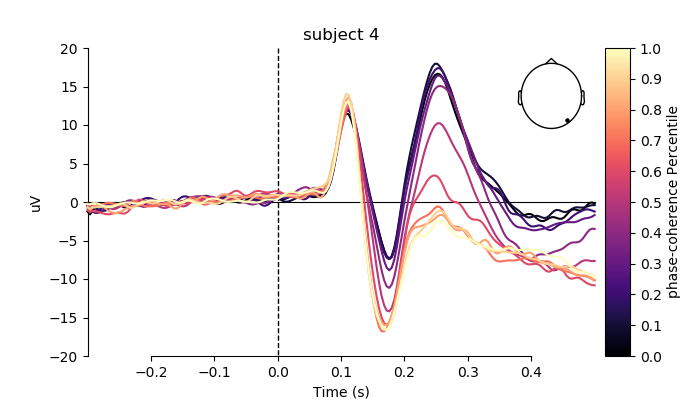
plot individual ERPs for three exemplary subjects
# create figs
for i, subj in enumerate(evokeds[0:3]):
    fig, ax = plt.subplots(figsize=(7, 4))
    plot_compare_evokeds(subj,
                         axes=ax,
                         title='subject %s' % (i + 2),
                         ylim=dict(eeg=[-20, 20]),
                         colors=colors,
                         split_legend=True,
                         picks=electrodes[2],
                         cmap=(name + " Percentile", "magma"))
plt.show()
Total running time of the script: ( 0 minutes 38.154 seconds)